Step-By-Step: Using a Manufacturer-Level Scan Tool to Diagnose False Error Codes
Using a manufacturer-level scan tool, start by cataloging codes and cross-checking with live data streams, freeze frames, and logs for inconsistencies. Verify the tool’s compatibility, update status, and access depth, then establish a baseline and run repeatable tests. Compare symptom signals to fault codes, distinguishing transient glitches from persistent faults. Reproduce scenarios with controlled inputs and document all inputs, outputs, and timing. If discrepancies persist, you’ll uncover deeper causes and sharpen your diagnostic confidence as you progress. More to come.
Understanding False Error Codes and Their Impact
False error codes can mislead diagnostics, so understanding their origins is essential. You’ll approach this with a precise, data-driven mindset, tracing every code to its source before acting. False codes arise from sensor noise, calibration drift, or PCM misinterpretation, not just a faulty component. You’ll perform impact analysis to gauge how a misleading code could affect safety, performance, and repair costs. Begin by cataloging codes, then cross-check with live data streams, freeze frames, and system logs to identify inconsistencies. If a code doesn’t align with current sensor values, flag it for deeper scrutiny. Document the discrepancy, note probable causes, and evaluate whether the issue is transient or repeatable. You’ll avoid blind replacements; you’ll validate with measurements, tests, and reproducible steps. This disciplined approach preserves freedom by preventing unnecessary interventions and empowers you to make informed decisions grounded in evidence rather than assumptions about “likely” failures.
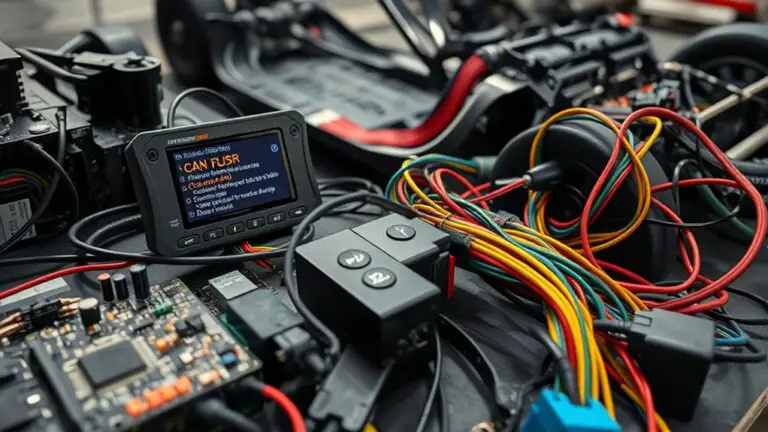
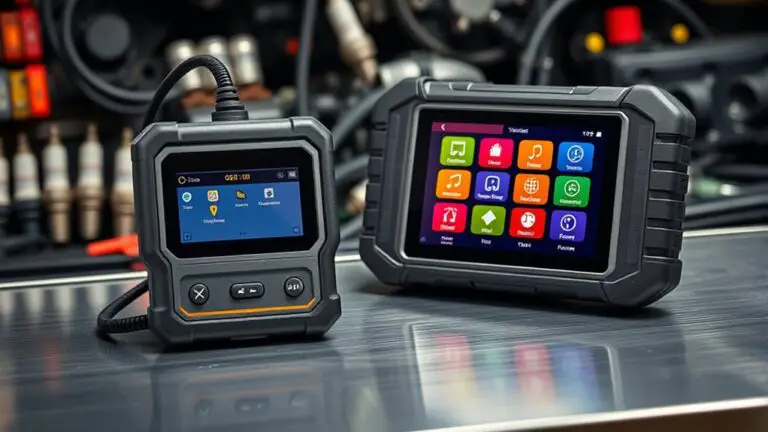
Choosing the Right Manufacturer-Level Scan Tool
Choosing the right manufacturer-level scan tool hinges on aligning its data access, coverage, and reliability with your diagnostic goals. You should evaluate how deeply the tool communicates with modules, the scope of supported protocols, and the speed of data retrieval. Prioritize diagnostic features that match your common failures, not just flashy interfaces. Compare scan tool brands by real-world coverage across your fleet, plus update cadence and ongoing support. Reliability matters: look for error-free data, clear status indicators, and stable software that won’t clog your workflow. Freedom here means choosing tools that empower you to verify codes without unnecessary detours. Use matrices to track compliance with your criteria, then test punch-ins against your typical scenarios. The right choice reduces dead-ends and accelerates root-cause analysis.
| Criterion | Example metric |
|---|---|
| Coverage breadth | Number of supported protocols |
| Update cadence | Weekly, monthly, quarterly |
Setting Up the Tool and Connecting to the Vehicle
Setting up the tool and connecting to the vehicle starts with a clear, repeatable process that matches the capabilities you prioritized when choosing a manufacturer-level scan tool. You begin by confirming device compatibility, power status, and the latest firmware, then establish a stable work environment. Next, perform a clean tool setup: initialize profiles, calibrate prompts, and verify license scope to guarantee you can access the data you need without surprises. For vehicle connection, choose the correct interface (OBD-II, CAN, or manufacturer-specific) and attach the connector firmly, keeping cable strain minimal. Power the vehicle to reduce read errors, then perform a quick system self-check within the software. Validate communications with a baseline здоровья diagnostic test and log the results. Document each step for repeatability, noting any deviations. With tool setup complete and vehicle connection established, you’re ready to proceed to diagnostic workflows efficiently and with disciplined data capture.
Navigating OEM-Specific Menus and Protocols
When you’re traversing OEM-specific menus and protocols, start by establishing a stable baseline from the vendor’s documentation and the tool’s built-in help resources. You’ll map each menu layer to a known function, then verify access levels, prompts, and timeout behavior. Use OEM navigation techniques to differentiate between menu branches, submenus, and hidden options without assuming defaults. Document exact button presses, lockouts, and error codes encountered during navigation to build a searchable reference for future sessions. Pay attention to protocol variations across manufacturers: some use read-only trees, others require explicit mode switches or credential prompts. Maintain a disciplined approach: confirm the intended operation, confirm results, then cross-check with the device’s status indicators. If a discrepancy appears, revert to the baseline and re-run the relevant branch. This methodical discipline preserves reliability while you retain the freedom to explore nuanced diagnostic paths.
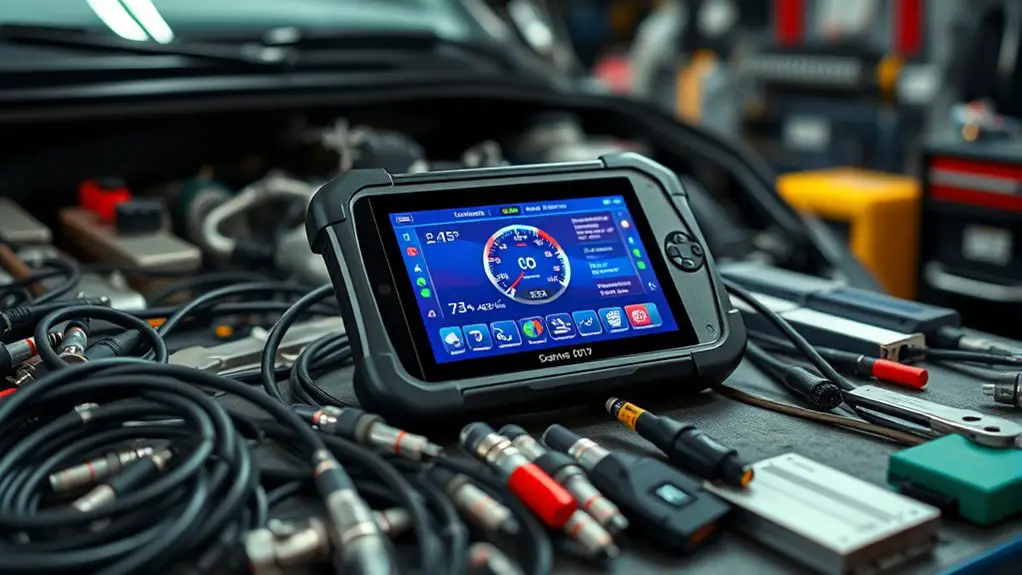
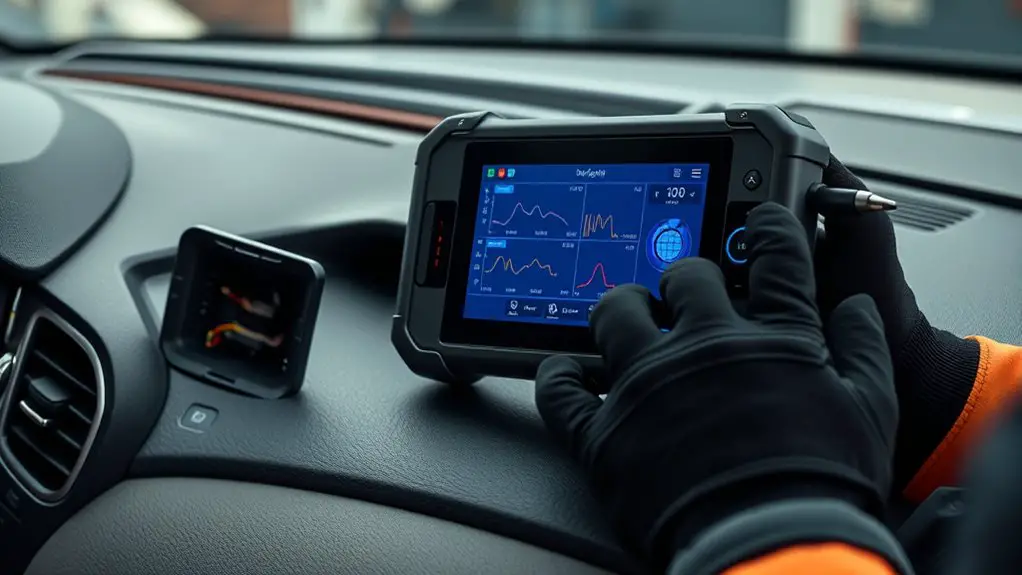
Interpreting Live Data Streams: Data PIDs and Sensors
Live data streams reveal the real-time state of a vehicle or system through Data PIDs and sensors, so you’ll approach them with a disciplined, systematic mindset. You’ll map each PID to a meaningful parameter, noting nominal ranges and recent trends to distinguish normal variance from faults. Your focus is live data interpretation: compare current values against expected behavior, not isolated numbers. Sensor readings provide context; verify that readings make physical sense given operating conditions, and watch for stale or filtered data that can mislead you.
Approach with a tiered mindset: establish baselines, then drill into anomalies, then validate with cross-checks (RPM, load, temperature, voltage). Document deviations, quantifying tolerance bands and confidence levels. Prioritize data streams that align with symptom patterns, and filter out noise by leveraging pause-and-compare or log replay. You’re aiming for actionable clarity, not every captured byte—extract the story the data tells about system health and potential false error codes.
Reconciling Codes With Symptoms and Freeze Frame Data
To reconcile codes with symptoms and freeze-frame data, start by aligning the diagnostic trouble codes (DTCs) with the observed symptom set and the exact fault snapshot captured when the code was stored. You’ll verify that the reported DTCs match the vehicle’s current behavior, noting any mismatches between Freeze Frame data and live conditions. Build a tight map: list each DTC, its failure mode, and the corresponding symptom analysis observations (engine behavior, odd sounds, smells, torque requests, and transmission responses). Check timestamps, RPM, vehicle speed, load, and fluid temps captured at the moment of the fault to confirm consistency. If a DTC appears without supporting symptoms, flag it for deeper verification; if symptoms exist without a matching DTC, consider a code misfire or a non-crucial fault. Document discrepancies and update your code correlation notes, ensuring conclusions remain data-driven and reproducible for subsequent verification.
Employing Systematic Troubleshooting Techniques
You’ll start with systematic troubleshooting steps to structure your approach and minimize guesswork. Use your diagnostic tool to collect, compare, and log data, validating each code against symptoms and history. By framing each step as testable actions—verify, measure, confirm—you build a clear, data-driven trail that guides you toward a reliable fault conclusion.
Systematic Troubleshooting Steps
Systematic troubleshooting starts with a plan: define the problem, gather knowns, and establish a baseline before testing any components. You’ll map symptoms to potential causes, then rank hypotheses by impact and likelihood. Next, isolate variables, starting with the most fundamental system functions, and document measurements precisely. Use repeatable tests to confirm or refute each hypothesis, avoiding assumptions. Maintain a traceable workflow: record inputs, results, and timestamped observations. Compare current data against baseline and manufacturer specs, noting deviations. When data diverges, reframe the problem using systematic approaches to analytical thinking, not guesswork. Prioritize steps that verify core operation before addressing peripheral concerns. This disciplined method supports thorough debugging, aligns with troubleshooting techniques, and preserves your freedom to validate each conclusion.
Diagnostic Tool Usage
Diagnostic tools are most effective when you apply the same systematic framework you use for diagnosis: define the failure mode, establish a baseline, and run repeatable tests that isolate variables. In this section, you’ll conduct a focused, data-driven diagnostic tool usage, prioritizing diagnostic tool comparison and precise error code interpretation. You’ll document inputs, expected vs. actual outputs, and timing to reveal anomalies without guessing. Use repeatable tests to confirm or refute hypotheses, keeping changes isolated and quantifiable. Maintain a calm, objective posture, and avoid overinterpreting transient readings. Below is a concise matrix to structure your observations and decisions during testing.
| Test phase | Measured variable | Outcome |
|---|---|---|
| Baseline | Vehicle state | Normal |
| Load test | Electrical load | Stable |
| Manual trigger | Code state | Pending |
| System reset | Recovery | Successful |
| Validation | Reproduction | Confirmed |
Error Code Validation
Error code validation hinges on applying repeatable, data-driven checks to confirm or refute the root cause suggested by the code. You’ll compare reported error code types against observed behavior, ensuring the symptom matches the diagnostic hypothesis. Systematically verify with multiple data points: freeze-frame data, live sensor readouts, and if available, tests that reproduce the condition. Document every step to establish code consistency across sessions and devices. Distinguish between transient glitches and persistent faults by repeating measurements under defined conditions. Correlate fault codes with functional tests, electrical checks, and component-level validation. Eliminate ambiguities by ruling out alternate causes before concluding. This disciplined approach prevents premature conclusions and aligns your investigation with real-world reliability and freedom from guesswork.
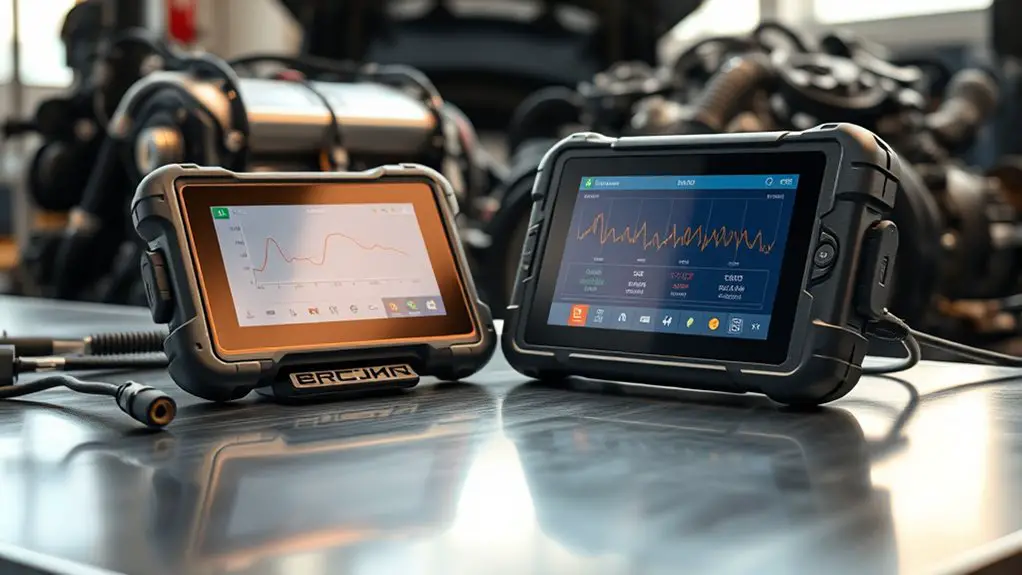
Cross-Verification: Using Additional Tests and Data Sources
Cross-verification relies on corroborating findings from multiple tests and data sources to confirm or refute a fault. You’ll pursue independent signals that can validate or challenge the primary code reading, keeping a disciplined, data-driven mindset. Focus on consistency across inputs, outputs, and behavior, then quantify deviations to decide if a false code exists. Use structured checks that enable rapid cross check methods and clear data comparison.
1) Run a live data snapshot alongside the recorded code history, noting anomalies and timing gaps.
2) Compare sensor trends from multiple diagnostic channels to identify discordant or drifting values.
3) Reproduce the symptom with alternate tests (benign vs. fault-specific scenarios) to test persistence.
4) Correlate code behavior with external data (fuel trim, ignition, MAF/MAH readings) to confirm or reject the fault signal.
Maintain documentation of each step, preserve traceability, and prioritize confirmation before repair decisions.
Documenting Findings and Verifying Repairs
You’ll start by documenting the exact findings from the scan tool and related tests, noting codes, Freeze Frame data, and observed symptoms with timestamps. Then you’ll outline the verification plan, including successful repairs, rechecks, and any residual indicators to confirm the issue is resolved. Finally, you’ll use objective data to compare pre- and post-repair results, ensuring each item aligns with the documented criteria.
Documenting Findings
After gathering the data from the scan tool, document each finding in a clear, organized format that ties symptoms to codes, confidence levels, and the affected systems.
1) Report discrepancies observed between live data and stored codes, noting any deviations in sensor readings and behavior.
2) Track patterns over time, mapping repeating codes to symptom clusters and correlating with environmental or operating conditions.
3) Associate each finding with confidence levels, documenting rationale for each assessment and any conflicting signals.
4) Record the affected systems and interfaces, highlighting dependencies and potential cross-talk that could generate false positives.
This systematic approach supports precise decision-making, ensuring you can defend conclusions, reproduce observations, and plan targeted follow-ups.
Verifying Repairs
When verifying repairs, you’ll re-run scans and compare current data against pre-repair baselines to confirm that previously observed codes and symptoms have diminished or disappeared, while remaining alert for any new anomalies that could indicate partial fixes or residual issues. This phase emphasizes repair confirmation and measurable repair effectiveness, using data-driven checks to validate outcomes and prevent regression.
| Data, Baseline, Outcome | Action, Observation, Decision |
|---|---|
| Baseline: pre-repair codes | Compare with post-repair scans to confirm code elimination |
| Post-repair: current data | Assess symptom changes and verify stability over multiple cycles |
| Documentation: logs, screenshots | Decide on pass/fail and next steps based on objective thresholds |
Frequently Asked Questions
How Do False Codes Affect Warranty Coverage?
False codes can affect warranty coverage, but only if you can prove they’re erroneous. You focus on warranty implications by documenting the fault, symptoms, and any code verification results from your scan tool. If a code is false, you may still face inspection requirements or exclusions, so gather data, timestamps, and technician notes. You’ll want clear, objective evidence showing the failure isn’t due to misuse. This data-driven approach supports your warranty claim and minimizes disputes.
Can Tool Updates Fix Lingering Miscodes Automatically?
Could tool updates fix lingering miscodes automatically? Not always, but they can reduce repeat errors if updates address known faults. You’ll want to verify tool compatibility first, since incompatible updates can worsen symptoms. Practice a systematic approach: run a full code clear, apply the latest release, then recheck. Consider update frequency and release notes to gauge impact. If miscodes persist, retest sensors, clears, or seek dealership guidance.
Which Codes Should I Ignore Without Verification?
Ignore any codes you haven’t verified; never dismiss all warnings. You should flag only common false starters and verify with live data, tests, or factory specs. Typical targets to scrutinize include P0xx, B0xx, and U0xx when they don’t align with symptoms. Use code examples from your scan tool’s database to compare trends, sensor data, and misfire patterns. If in doubt, double-check with a verified diagnostic procedure before ignoring codes; your freedom isn’t reckless.
Do OEM Tools Log Diagnostic Session History Locally?
Did you know that OEM tool usage logs can hover around 60–90% capture rates for diagnostic sessions? Yes—OEM tool functionality often includes diagnostic session tracking, with local logs stored on the tool or associated workstation. This means you can access recent sessions, timestamps, and codes. If you need reproducibility, you’ll rely on these records to corroborate findings, while maintaining compliance and safeguarding sensitive data.
How Reliable Are Third-Party Extensions for OEM Data Access?
Third-party reliability varies, but data access can be inconsistent and patchy. You’ll often find mixed results in latency, API stability, and vendor support. If you rely on third-party extensions, expect guards, rate limits, and licensing terms that affect uptime. On balance, third party reliability hinges on vendor maturity and integration tests. You should quantify access latency, error rates, and reboot cycles, then compare against OEM baselines before committing to any data access solution.