How Road Hazards Cause Speed-Rated Tire Wear and What to Inspect
Road hazards stress the contact patch and shift load, accelerating wear on speed-rated tires. Potholes, debris, and rough pavement cause uneven footprint pressure, micro-slips, and heat buildup, leading to edge cracks, cupping, and faster tread loss. Inspect tread depth, sidewalls, and surface irregularities, plus check inflation, alignment, and suspension. Regular rotations and data-driven tracking of wear help forecast remaining life. If you keep exploring, you’ll uncover how to quantify hazards and sharpen maintenance plans.
Understanding How Road Hazards Affect Speed-Rated Tires
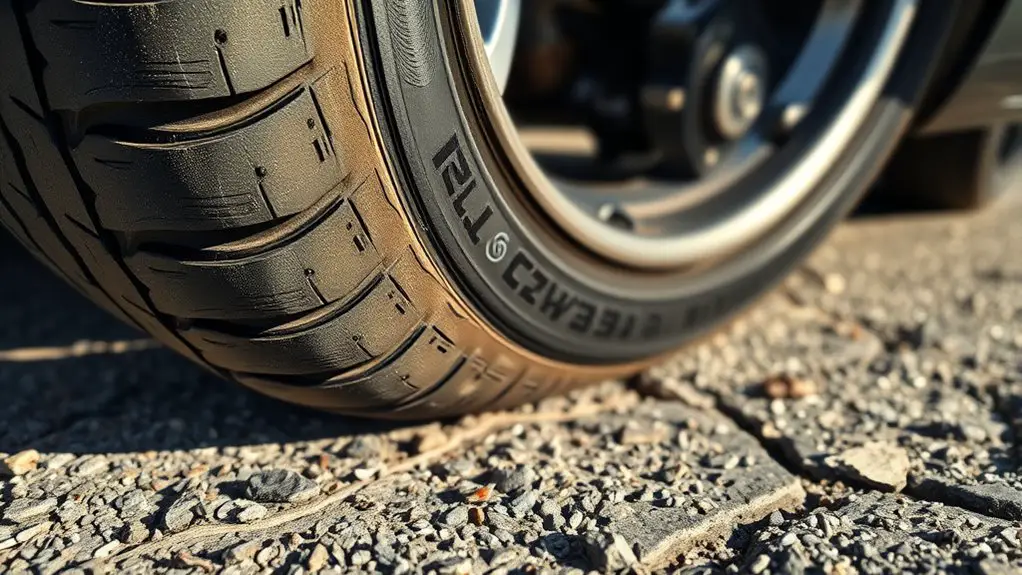
Road hazards directly influence how speed-rated tires wear by altering contact patch dynamics and load distribution. You’ll see changes in tire performance reflected as altered grip, wear patterns, and potential speed-rating degradation under stressed conditions. In practical terms, pavement irregularities, debris, and surface defects shift pressure across the footprint, elevating instantaneous contact pressures and promoting uneven wear. Speed-rated tires rely on precise tread and casing behavior at elevated speeds; disruptions from road hazards can cause micro-slips that heat compounds, accelerate tread polish, or introduce localized abrasion. Data from controlled tests show that consistent loading shifts, such as pothole encounters, correlate with measurable reductions in uniform wear indicators over time. Road conditions matter for thermal profiles, cooling rates, and carcass integrity, influencing how long the tire maintains its intended performance envelope. You gain clarity when interpreting wear signs as indicators of evolving tire performance and the need for proactive inspection.
Common Hazard Types and Their Impact on Tread and Sidewalls
Common hazards come in several forms, each with distinct effects on tread and sidewalls. You’ll see how different categories translate into measurable wear patterns, puncture risk, and sidewall deformation. Loose gravel and sharp shards create concentrated contact stresses that accelerate tread chunking and micro-splitting, reducing tire performance under load. Potholes induce rapid, dynamic deformation, elevating belt edge exposure and could trigger edge cracks or belt misalignment if you regain speed abruptly. Curb impacts damage shoulder zones, elevating shoulder softness and accelerating tread squirm in cornering, especially at higher pressures. Nail, screw, and glass fragments puncture tread grooves, potentially compromising casing integrity while leaving sub-surface indicators as telltales for wear progression. Heavier debris, like construction debris, amplifies abrasion across tread blocks and raises interior noise from sidewall flexing. Across all hazards, you’ll observe correlations between impact type, energy transfer, and measured tire performance metrics, guiding inspection priorities and maintenance timing without sacrificing driving autonomy.
How Speed Ratings Influence Tire Wear Under Harsh Conditions
Speed ratings influence tire wear under harsh conditions by governing heat buildup, stiffness, and contact patch behavior, which in turn modulate wear patterns during high-load or aggressive driving. You’ll find that higher speed ratings tolerate greater rim-to-tire heat flux and maintain more stable stiffness at speed, reducing localized shear but increasing edge wear in sustained high-temperature environments. Conversely, lower speed-rated tires exhibit greater tread-temperature gradients, accelerating compound aging and uneven wear when harsh conditions push throttle, braking, or cornering aggressively. In practical terms, your wear risk shifts with load profiles, ambient temperature, and road shear: speed ratings determine thermal margins, deformation under cornering, and tread-block interaction with the road. Monitoring real-world operating temps via data-logging, you can align driving behavior with tire design limits. When harsh conditions prevail, choose a rating that pairs target performance with predictable wear trajectories, and inspect tread depth and tread-void geometry accordingly. speed ratings, harsh conditions.
Recognizing Wear Patterns Caused by Potholes, Debris, and Rough Roads
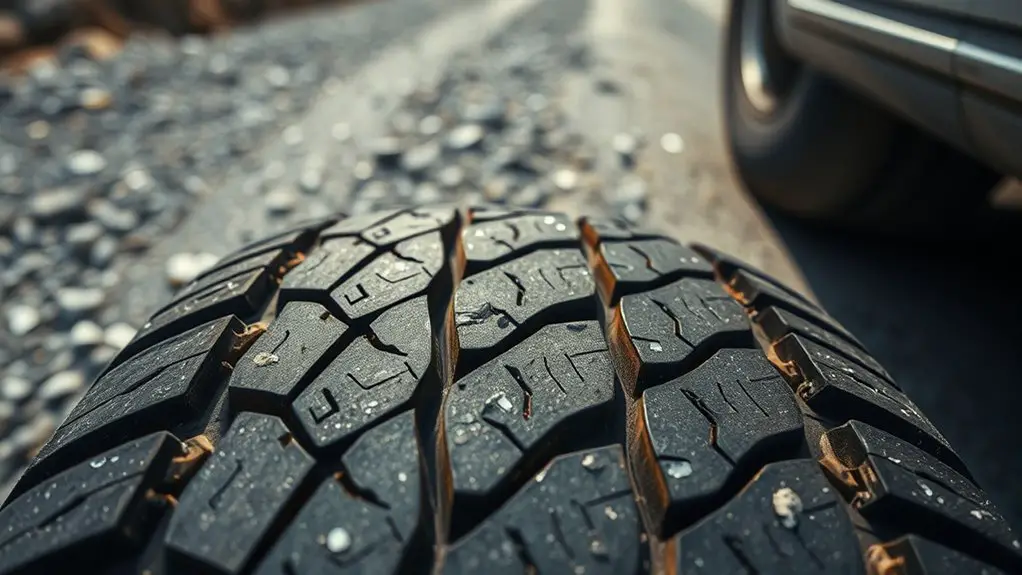
Pothole impacts produce distinct tire imprint patterns and edge damage that you can document as early indicators of accelerated wear. Debris tracks create irregular scrape marks and micro-puncture footprints, signaling localized material loss. Recognize these signatures—Pothole Impact Signs and Debris WheelImprints Patterns—to prioritize inspection and maintenance decisions.
Pothole Impact Signs
Pothole impact signs appear as distinctive tire wear patterns that reflect the vehicle’s interaction with rough pavement, debris, and sudden jolts. You’ll notice shoulder wear, cupping, and edge feathering consistent with localized impact forces, not gradual wear. In daily checks, compare tire tread depth at the inner, center, and outer ribs to identify asymmetry suggestive of pothole loading. Data-driven impact analysis correlates irregular wear to known pothole locations, steering corrections, and suspension response, enabling targeted maintenance decisions. Look for rapid tread loss on the front axle if the pothole strikes rearward, or mixed cupping across both axles indicating multiple encounters. Document incident dates, speeds, and road conditions to improve pothole identification accuracy and refine inspection intervals for speed-rated tires. This approach enhances safety while supporting freedom through proactive risk management.
Debris WheelImprints Patterns
Debris wheelprint patterns emerge as a distinct diagnostic signature when tires encounter potholes, loose gravel, and rough road surfaces. You’ll observe systematic imprints that reveal debris types and wheel impacts, enabling precise wear attribution. This pattern remains data-driven: quantify impact frequency, location, and depth to separate transient from sustained damage, informing inspection priorities.
- Distinct rim-to-tread imprints point to wheel impacts from sharp debris and edge breaks.
- Radial scoring aligned with lane grooves indicates repeating pothole encounters.
- Asymmetric wear halos reflect off-center debris contact and steering input.
- Groove interruption and micro-abrasion differentiate debris types from road texture.
Key Inspections to Detect Early Tire Wear and Damage
Visual tire inspection basics establish a baseline by systematically checking tread depth, surface wear, and irregularities. By correlating observed tread wear patterns with known causes, you can flag early damage before it escalates. Structural damage checks complement this by confirming belt or sidewall integrity through targeted, data-informed assessments.
Visual Tire Inspection
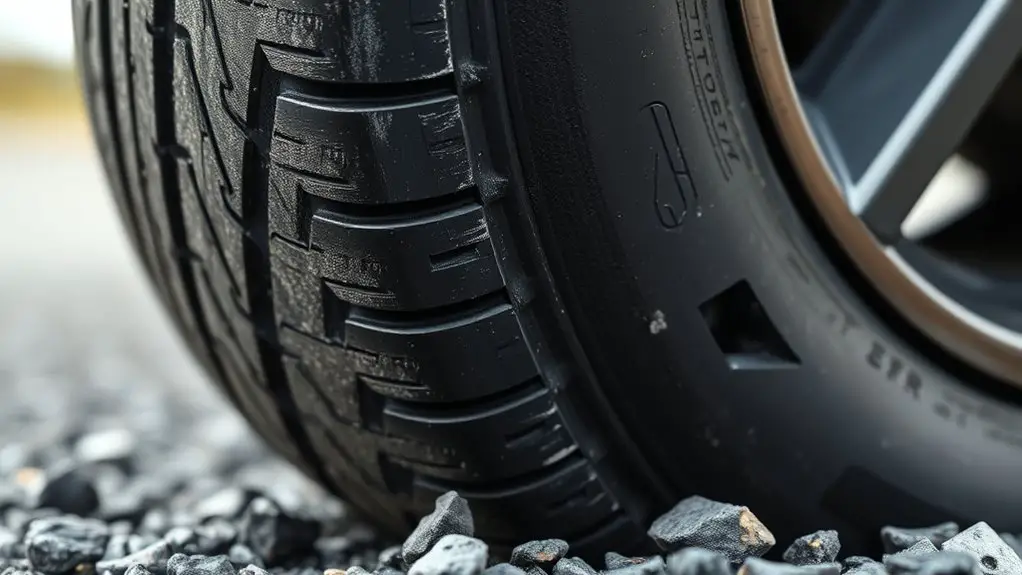
A thorough visual tire inspection involves a systematic, data-driven check of tread depth, sidewall condition, and surface irregularities to detect early wear and damage before they affect performance.
- visual inspection techniques: you assess tread uniformity, measure remaining depth with a gauge, and note any cuts, bulges, or embedded objects with precise description.
- tire surface analysis: examine crest wear, shoulder wear, and cupping patterns, correlating findings with wheel alignment and load history.
- lighting and angles: inspect at multiple angles and under consistent lighting to reveal subtle defects that might hide in shadow.
- documentation: record measurements, images, and dates to track progression and inform proactive maintenance.
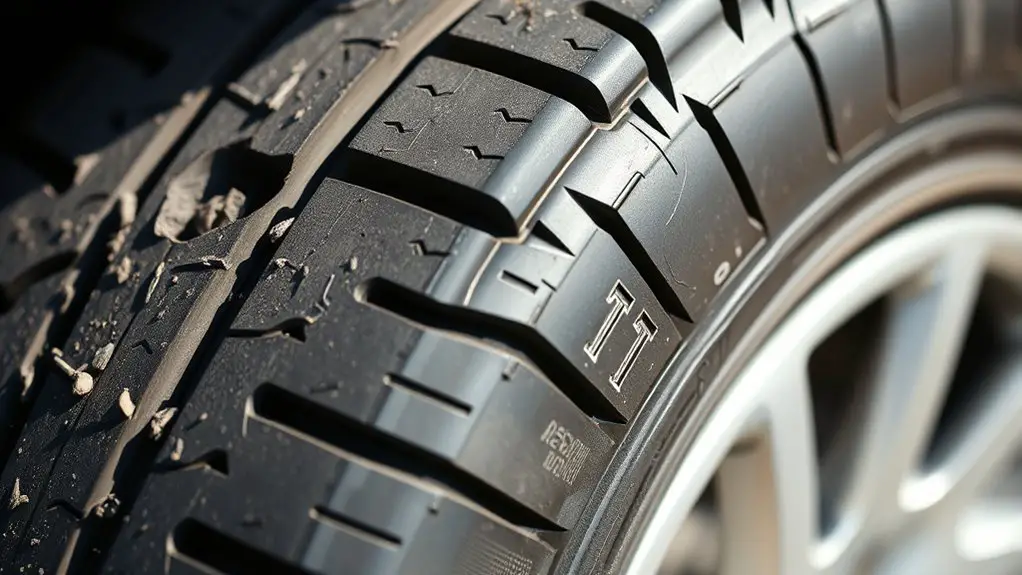
Tread Wear Patterns
Tread wear patterns provide early clues to underlying issues, allowing you to intervene before performance and safety are compromised. You examine tire contact patches for irregularities that signal uneven loading, misalignment, or suspension concerns. Pay attention to cupping, flat spots, and edge feathering, each correlating with distinct fault sources and wear rates. Compare tread depth across the shoulder, center, and ribs to quantify nonuniformity; significant differences point to rotation needs or pressure adjustments. Look for consistent diagonal or inboard wear, which can indicate steering or camber issues, while gaited wear along one shoulder may reveal underinflation or overloading. Document tread depth measurements and track progression over cycles to forecast remaining life. Recognize that tread design influences wear accents and roadside performance, guiding proactive maintenance and tire selection decisions.
Structural Damage Checks
Structural integrity is the next layer of inspection after evaluating wear patterns, because hidden damage can undermine safety even when tread appears acceptable. You’ll verify structural health using objective checks, focusing on measurable indicators that predict failure risk. This data-driven approach blends visual cues with technical tests to inform decisions about tire safety and vehicle handling.
1) Inspect sidewall integrity for gouges, bulges, or cracking that hint at internal ply or belt damage and potential air loss.
2) Evaluate bead seating and rim interface to confirm proper seal and rotation performance under load.
3) Check tread-root delamination risks by probing for separation near the belt line and across shoulder regions.
4) Assess tire alignment effects on wear asymmetry, noting how abnormal camber or toe can exaggerate damage signals and compromise control.
Maintenance Practices to Mitigate Hazard-Related Tire Wear
To mitigate hazard-related tire wear, implement a structured maintenance plan that targets alignment, suspension health, and tire condition, since misalignment and damaged components accelerate tread loss on uneven road surfaces. You should schedule regular alignment checks, inspect steering and suspension components for play, and address worn bushings or ball joints promptly. Data-driven tyre management requires consistent tire rotation schedules to even tread wear, ideally per vehicle manufacturer guidance, plus cross-rotation when mismatched tires exist. Maintain proper inflation with frequent pressure monitoring to prevent heat buildup and irregular wear patterns on speed-rated tires. Use tread depth measurements and wear indicators to detect early anomalies before hazards translate into rapid degradation. Track tire seasonal shifts and road exposure to refine maintenance intervals. Integrate tire condition data with vehicle service history to forecast future replacements, and document outcomes to optimize risk-adjusted maintenance. Freedom in practice comes from disciplined, measurable maintenance actions.
Frequently Asked Questions
How Do Speed Ratings Relate to Tire Wear Under Different Road Hazards?
Speed ratings influence tire performance under hazards: higher ratings generally improve stability and grip, reducing wear from abrupt maneuvers, while lower ratings heat up faster and wear unevenly on rough surfaces. On potholes or debris, risk shifts toward sidewall damage rather than tread wear, but all speeds stress components. You’ll see accelerated wear if you push limits beyond approved conditions. Track data shows consistent alignment between speed ratings and tire performance, especially under aggressive driving or compromised road conditions.
Can Tire Wear From Potholes Be Reversed or Repaired?
Pothole damage isn’t reversible in the tire’s original structure, so you shouldn’t expect a full repair. You can mitigate risk with professional tire repair for localized damage, but deep cuts, bulges, or tread separation require replacement. Data shows repairability windows are narrow and reliability falls with speed and weight. If you insist on continuation, monitor inflation and alignment. Prioritize tire repair only for minor impacts; otherwise replace to reduce unsafe pothole damage risk.
Do All Hazards Affect Tread and Sidewalls Equally?
All hazards don’t affect tread and sidewalls equally. You’ll see more tread damage with sharp objects or high-impact hits, while soft sidewalls show sunken bulges and cracking sooner. In practice, expect varied damage patterns that alter tread wear rates and sidewall integrity differently. You must inspect both tread damage and sidewall integrity—don’t ignore subtle shifts. Data show inconsistent wear paths across hazards, so monitor vibration, calibrated tread depth, and bead area for reliable safety.
Should Tire Pressure Checks Differ After Hitting Debris or Rough Roads?
Yes—you should check tire pressure more carefully after debris impact or rough roads. Recheck within 24 hours, then again after a short drive to settle temps. Monitor for slow leaks or abrupt pressure changes, and inspect for curb or bead damage. Record tire pressure data, compare to manufacturer specs, and watch for uneven wear. Debris impact can cause micro-leaks; maintaining proper tire pressure minimizes heat buildup and preserves performance.
What Warning Signs Indicate Imminent Hazard-Induced Tire Failure?
Sure. Warning signs include tire bulging and uneven wear, signaling imminent hazard-induced tire failure. You should stop, inspect for embedded debris, sidewall cuts, and missing tread shoulders before continuing. In data terms, bulges indicate internal ply separation; uneven wear shows irregular loading or alignment issues. If you notice rapid temperature rise or audible thumps, treat as high risk. Stay proactive: replace compromised tires and recalibrate suspension to maintain safe, freedom-loving driving.