How to Interpret Inaccurate Sensor Readings When Scanning a Modern OBD-II Cars
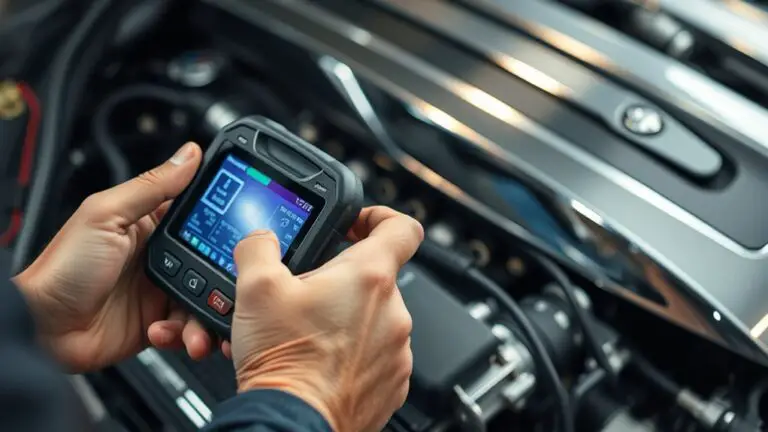
When you see odd sensor data on an OBD-II scan, treat it as clues, not conclusions. Start by ruling out obvious hardware issues and wiring problems, then compare live values against expected ranges using multiple sensors for the same system. Distinguish glitches from faults by timing, repeat tests, and logging with timestamps. Cross-check readings with manufacturer data and known cycles, and validate with real-world tests or drive cycles. If anomalies persist, you’ll uncover deeper, systematic patterns as you proceed.
Common Causes of Sensor Anomalies in OBD-II Systems
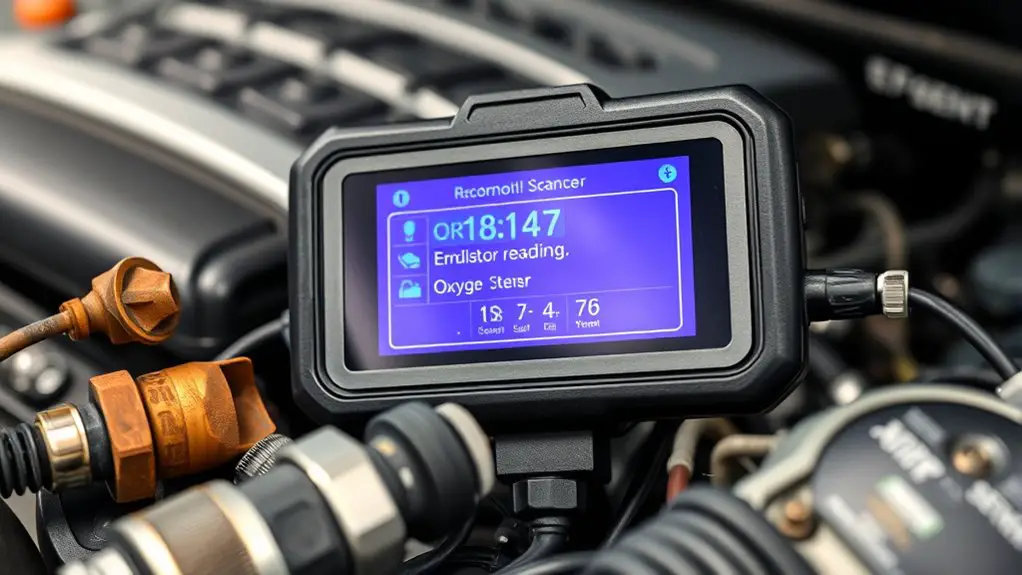
Common sensor anomalies in OBD-II systems usually stem from hardware issues, wiring problems, or environmental factors. You’ll approach this with a precise, methodical mindset, targeting the root cause before chasing the symptom. Begin by validating sensor types involved in the reading—temperature, pressure, oxygen, and mass air flow—so you don’t mix signals from different subsystems. Next, inspect harnesses and connectors for corrosion, fraying, or loose pins; compromised wiring is a frequent culprit. Use diagnostic tools to compare live data against expected ranges, noting consistent offsets, intermittents, or stalls. Rule out power supply issues first: a marginal supply can masquerade as sensor fault. Calibrate sensors when the manufacturer allows, and document any adaptation codes. Consider environmental factors like ambient temperature, vibration, and exposure to chemicals, which can skew readings. If anomalies persist, isolate the sensor circuit with a controlled test, then re-evaluate readings against reference values. You’ll gain reliability by targeting the exact sensor type and employing proper diagnostic tools.
Distinguishing Transient Glitches From Genuine Faults

You’ll start by distinguishing a transient glitch from a true fault, using timing as your first criterion. Consider brief, non-repeating anomalies as likely glitches, while persistent or repeating patterns suggest a fault. Validate with repeatable tests and note whether readings stabilize or worsen over time to guide your next steps.
Transient vs. Fault
Transient glitches are momentary sensor readouts or processing hiccups that don’t reflect a real fault in the vehicle’s systems; distinguishing them from genuine faults requires a disciplined approach, including repeat measurements, corroborating data from multiple sensors, and checking for environmental or interaction causes that could skew readings. You should compare related sensor types and seek consistent trends rather than isolated spikes. Use diagnostic tools to log time-stamped data and assess whether anomalies persist across driving conditions or vanish after a reset. Correlate with fault codes, freeze frames, and live data streams to determine if a true fault exists. When uncertainty remains, continue monitoring and document patterns before attributing a fault to the system.
Validity by Timing
When you’ve ruled out obvious transient glitches in the previous section, assess validity by timing. You measure whether sensor response is consistent across cycles and within spec’d update rates. Look for timing discrepancies between affected channels and the ECU’s expected polling cadence. If readings shift only after a known delay or recover quickly without correlating fault codes, note the transient pattern rather than a fault. Conversely, a persistent misalignment between actual measurable values and stored data signals a genuine fault. Use a controlled load, or steady engine state, to recheck. Document the duration, repeatability, and any correlating conditions. Timing-driven evidence strengthens conclusions and helps you avoid chasing noise, ensuring your interpretation reflects real sensor behavior rather than artifacts.
Calibration Checks: Verifying Sensor Accuracy
Calibration drift factors can skew readings, so you start by identifying which sensors are most susceptible and when drift tends to occur. Use reference measurement methods to confirm baseline accuracy, and then map results against known field conditions through structured validation steps. This sets the groundwork for targeted calibration checks that you can repeat reliably under real-world driving scenarios.
Calibration Drift Factors
Calibration drift factors quantify how sensor readings diverge over time due to aging, thermal cycling, and electrical stress. You’ll assess drift by tracking periodic measurements against stable references, noting systematic shifts and random noise. Focus on how calibration techniques reveal whether drift is within tolerance or warrants recalibration, replacement, or firmware updates. Documenting ambient conditions and duty cycles helps separate environmental effects from intrinsic sensor aging. You’ll compare raw values to expected baselines, quantify offsets, and estimate recalibration intervals. Sensor drift often manifests as scale or offset errors, compounding with multiplexed inputs. Use concise notes and traceable data to support decisions about OBD-II probes and modules. Keep a disciplined log to preserve diagnostic integrity and preserve your freedom to interpret readings confidently.
| Factor | Action |
|---|---|
| Aging | Monitor gradual shifts |
| Thermal | Record temperature effects |
| Electrical | Check supply stability |
| Reference | Validate against baseline |
Reference Measurement Methods
To verify sensor accuracy, establish a disciplined reference measurement protocol that compares probe readings against stable standards under controlled conditions. You’ll rely on reference standards to benchmark performance and quantify measurement accuracy, minimizing drift with periodic checks. Follow precise procedures, document outcomes, and isolate variables to preserve integrity.
- Use calibrated reference standards with traceability to recognized bodies
- Conduct ambient controls (temperature, voltage) consistent across tests
- Record baseline readings before each measurement session
- Repeat measurements to compute repeatability and identify outliers
- Compare probe results against established thresholds, updating procedures as needed
Field Validation Steps
Field validation steps begin with a structured calibration check to confirm sensor accuracy in real-world conditions. You perform a controlled comparison between OEM and scanned values, then assess data consistency across channels. If drift appears, you adjust baselines and log the delta for traceability. Precision hinges on repeatable tests, documented ranges, and verified reference sources. Maintain strict, objective criteria: thresholds, timing, and environmental factors. Follow a methodical sequence, recording every value, every anomaly. Field validation, when done well, builds trust in readings and empowers swift diagnostics.
| Step | Action | Outcome |
|---|---|---|
| 1 | Establish reference | Baseline accuracy |
| 2 | Run parallel tests | Data consistency check |
| 3 | Log environmental factors | Context for variance |
| 4 | Reconcile discrepancies | Calibrated sensor set |
Cross-Referencing Sensors for Consistent Readings
When readings from different sensors disagree, cross-referencing them helps identify which signal is likely inaccurate and why. You’ll use cross sensor comparison to build a coherent picture of the system, then confirm with data correlation techniques that reveal patterns, timing, and plausibility.
- Compare parallel sensors for the same parameter to spot outliers
- Align readings to the same time frame to avoid phantom discrepancies
- Check expected ranges against known operating modes and conditions
- Look for corroborating signals from related sensors to confirm trends
- Document anomalies and repeat measurements to establish consistency
This approach keeps your workflow precise and diagnostically focused, while preserving your sense of freedom to investigate hypotheses. By continuously validating one signal against others, you reduce guesswork and strengthen trust in the scan data. Remember, cross sensor comparison isn’t about a single perfect value—it’s about a dependable consensus across inputs, using data correlation techniques to reveal the most plausible reading.
Impact of Wiring, Grounds, and ECU Glitches on Data
Even as you compare sensor readings for consistency, wiring, grounds, and ECU glitches can turn clean signals into misleading data. You’ll notice that small voltage drops, loose pins, or corroded connectors alter signal timing and amplitude more than you expect. Focus first on wiring integrity: trace each harness path, verify shielding, and check for abrasion that could introduce noise or intermittent contact. Next, inspect ground connections; a poor chassis or battery ground can shift reference levels, producing spurious oxygen or temperature readings. ECU glitches aren’t mystic; they often stem from marginal power stability or parasitic loads that reset sensor calibrations mid-cycle. Document observed inconsistencies and re-test after reseating connectors or tightening grounds. When data suddenly drifts, differentiate sensor fault from interference by swapping a suspect line with a known-good reference. Maintain diagnostic discipline: repeatable patterns, not one-off quirks, reveal true data integrity amid the wiring maze.
Interpreting Readings With Manufacturer Data and Scanners
Manufacturer data and scan results are your anchor for distinguishing real sensor behavior from noise. When you interpret readings with manufacturer data and scanners, you compare live results against documented ranges and update cycles. Look for consistency across same model, year, and variant, and note any known factory tolerances. Use diagnostic tools to verify engine load, RPM, and sensor voltage patterns against expected profiles, not isolated spikes. If a reading diverges, check for corroboration from multiple sensors feeding the same subsystem before revision.
Manufacturer data and scan results anchor sensor interpretation, guiding cross-checked, corroborated readings.
- Validate data against manufacturer-spec cycles and update histories
- Cross-check with multiple diagnostic tools for consensus
- Correlate sensor voltage and resistance with documented norms
- Watch for known calibration or TSB-based adjustments
- Document deviations and retain baseline for future comparisons
Practical Steps for Test Drives and Real-World Verification
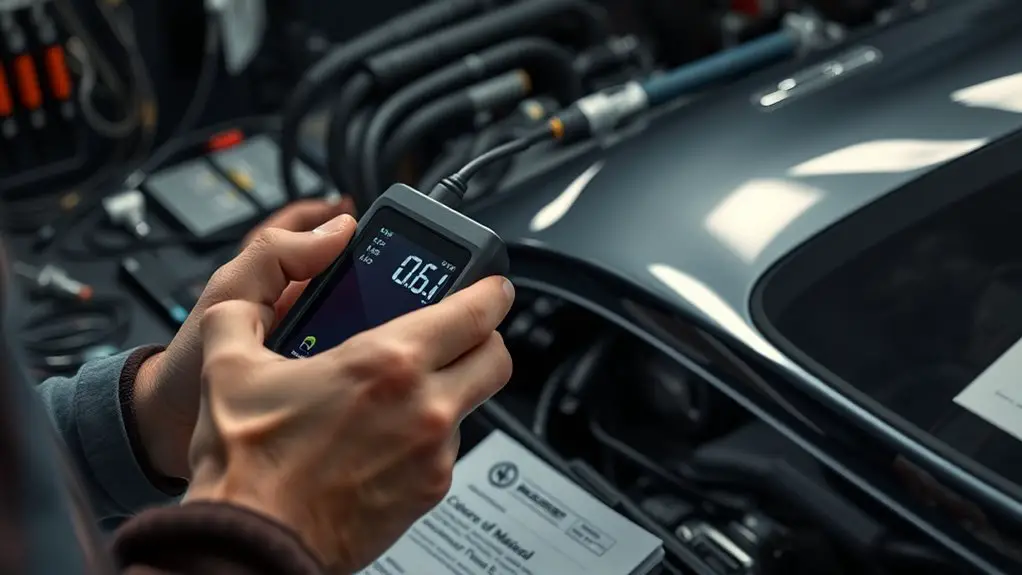
To validate sensor behavior in real-world conditions, you implement focused test drives that mirror typical operating cycles and known fault modes. You’ll execute structured runs, logging every parameter change, throttle input, and load. Begin with baseline data from a calm start, then introduce controlled variables that challenge sensor performance without pushing safety limits. Use consistent road types, speeds, and gear selections to compare readings against reference expectations from manufacturer data and prior scans. Follow clear diagnostic procedures: recheck connectors, verify grounding, and confirm harness integrity before interpreting anomalies. During drives, annotate moments of divergence between gauge, scan, and real-world cues, noting duration and environmental context. Record corroborating factors—transmission behavior, fuel trim, cooling status—to avoid overinterpretation. Conclude each session with a concise gap analysis, prioritizing repeatability over speculation. This disciplined approach guarantees meaningful insights while preserving drivability and safety.
Avoiding Overreaction: Prioritizing Drivability Symptoms Over Numbers
When symptoms and numbers diverge, you should treat drivability cues as the primary signal and reserve numerical anomalies for verification. In drivability analysis, trust how the car behaves over what a dashboard gauge suggests. You’re charting a path from feel to fact, not from a single digit to certainty.
- Prioritize smoothness, power response, and idle stability over isolated sensor flickers
- Flag persistent drivability changes for symptom assessment before chasing calibration fixes
- Cross-check multiple symptoms to confirm a pattern, not a coincidence
- Document conditions (temperature, fuel level, load) that influence readings
- Use numerical data to support, not dictate, your diagnostic hypothesis
Frequently Asked Questions
How Can Sensor Drift Impact Long-Term OBD-II Readings?
Sensor drift can skew long-term OBD-II readings, gradually masking true engine conditions. You’ll notice gradual offsets, so you should perform regular sensor calibration and trend checks. Track drift identification by comparing live data against known reference values and historical baselines. If discrepancies grow, recalibrate or replace the sensor. Maintain a diagnostic log, verify with controlled inputs, and guarantee calibration intervals suit driving conditions. Consistent, methodical checks protect accuracy and support confident, freedom-driven diagnostics.
Do Intermittent Faults Show up in Freeze-Frame Data?
Did you know that about 60% of intermittent faults are only captured when a specific load or temperature condition occurs? Yes, they can show up in freeze frame data, but not every time. Freeze frame relevance hinges on the exact moment of fault; often, intermittent fault detection relies on correlating multiple data points over time. You should verify by re-checking with consistent conditions and documenting patterns to confirm the issue.
Can ECU Firmware Affect Sensor Accuracy More Than Hardware Issues?
Yes, ECU firmware can affect sensor accuracy more than hardware, but only if updates introduce firmware bugs or calibration issues you can’t ignore. Start by checking ECU updates and calibration data for anomalies, then review signal processing paths for latency or шум. If readings drift after a firmware change, roll back or reflash to stabilize. Cross-check with independent sensors to confirm, and document every calibration tweak for future diagnostics.
How to Distinguish Sensor Faults From Transmission-Related Signals?
You distinguish sensor faults from transmission signals by isolating variables during sensor diagnostics, then cross-checking signal interpretation. Start with baseline scans, note abnormal readings, and compare them against known transmission-induced patterns. Use controlled tests: swap suspected sensors, monitor voltage and frequency, and assess response time. If discrepancies persist after swapping, suspect sensor faults; if shifts align with gear changes or torque, attribute to transmission signals. Document steps, preserve data, and guarantee calibration remains current.
Are There Quick Checks to Validate Sensor Scaling Factors?
Yes—quick checks exist. You can verify sensor scaling factors by cross-checking readings against known-good references, re-running calibration steps, and comparing live sensor outputs to ECU-reported values during steady-state conditions. Look for consistency after applying sensor calibration and run a controlled test (temperature, load). If disparities persist, perform scaling adjustments in small increments, document changes, and confirm with a second data set. You’ll feel confident when the numbers align within spec.