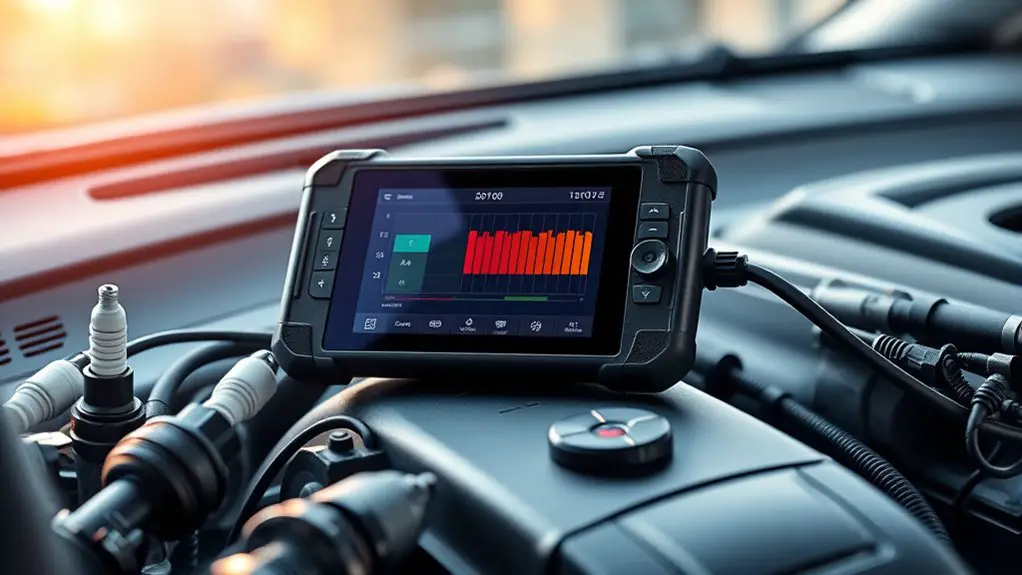
Step-By-Step: Using a Manufacturer-Level Scan Tool to Diagnose Live Data Misinterpretation
Step-by-step, you’ll connect a manufacturer-level scan tool and verify the vehicle’s model, chassis interface, and handshake. Start with a live data scan to confirm the data stream flow and integrity. Configure essential gauges—RPM, coolant, sensor voltages—and group them for quick assessment. Differentiate real faults from misreadings by cross-checking parameters, units, and scaling, and watch for timing windows and data freshness. If issues persist, you’ll see how repeating steps reveals deeper insights as you proceed.
Verifying Tool Setup and Data Stream Availability

To verify your setup and confirm data stream availability, start by connecting the tool to the vehicle and powering it on. Verify that the tool recognizes the vehicle model and chassis interface, and confirm host compatibility. Next, guarantee the diagnostic cable is securely seated and the power supply remains stable throughout the session. Initiate a brief system handshake to establish a baseline communication channel, then check for any fault indicators or warning banners presented by the tool’s interface. Proceed to run a preliminary scan to confirm data stream flow from essential modules; observe latency, baud rate, and timestamp alignment. Perform a focused check on data integrity by sampling representative live values and confirming they update coherently with known system behavior. Emphasize tool calibration during this phase to align sensor readings with reference standards. If discrepancies appear, pause and document exact conditions before continuing. This disciplined approach preserves data integrity and supports confident troubleshooting.
Configuring Live Data Views for Accurate Readouts
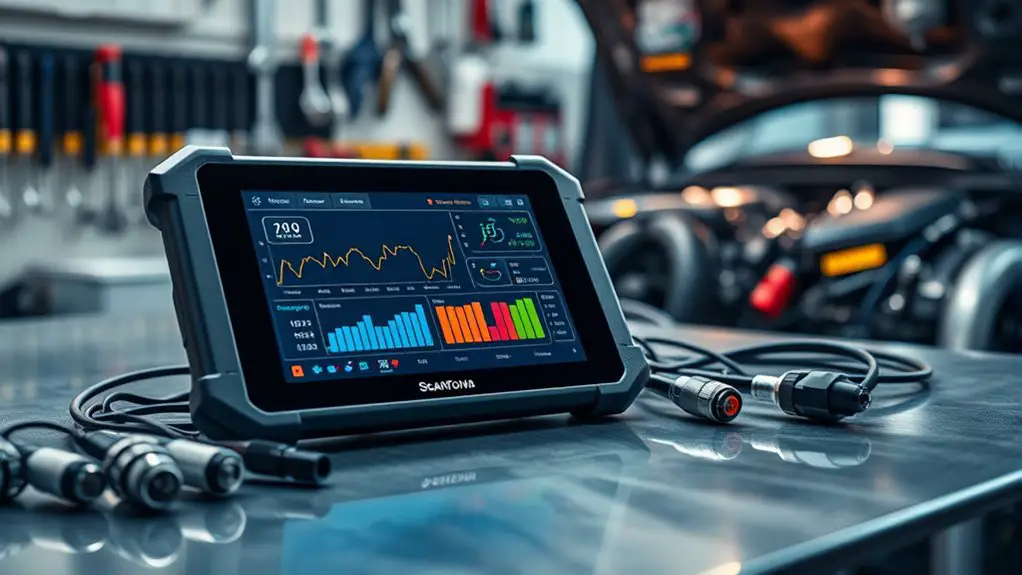
Once you’ve verified that the data stream is healthy, focus on configuring live data views to reflect accurate readings. You’ll tailor views to emphasize critical parameters, reducing noise and preventing misinterpretation. Begin by selecting essential gauges and metrics—engine RPM, coolant temp, and sensor voltages—then group them logically to support quick assessment. Use live data visualization to map units, scales, and alert thresholds precisely, ensuring color cues align with actionable ranges. Configure dashboards to display mirror-like, real-time trajectories rather than static snapshots, so drift or spikes stand out immediately. Implement a consistent refresh cadence and enable auto-scaling where appropriate to preserve readability across driving conditions. Keep layouts modular, allowing you to swap in advanced views without overhauling the setup. Document your configuration decisions for future reference, and test under diverse scenarios to confirm that the visualization supports rapid, confident diagnostics.
Distinguishing Real Faults From Misreadings in Real Time

When you vet real-time data, you must separate signals from reality by confirming anomalies across multiple parameters and sources. Compare live readings against expected baselines, known fault codes, and recent sensor behavior to rule out transients or sensor errors. This approach builds confidence that a detected fault reflects actual conditions, not misreadings.
Real-Time Data Vetting
Real-time data vetting requires a disciplined approach: you must distinguish genuine faults from sensor glitches and wiring quirks as they appear. You’ll perform real time validation by cross-checking multiple parameters, noting data discrepancies, and confirming consistency across related channels. When a value diverges, pause and verify with alternate sensors, known-good baselines, and tool diagnostics before authorizing any conclusion. Document suspected causes, applying a hypothesis-driven method to rule out noise, grounding issues, or latency. Stay factual, measure twice, act once. This process preserves trust in live data and supports timely decisions without overreacting to every anomaly.
| Parameter group | Verification steps |
|---|---|
| Sensor signals | Cross-check with alternate sensor, baseline comparison, latency check |
| Wiring & grounding | Inspect connectors, re-seat, verify impedance, shield integrity |
| Timing & latency | Compare timestamps, assess bus load, observe sampling rate |
| Ground truth | Correlate with engine state, boilerplate healthy ranges |
| Historical data | Review trend, flag recurring discrepancies |
Signals Vs Reality
Distinguishing real faults from misreadings in real time requires disciplined validation: don’t react to a single outlier, verify across multiple data streams, and corroborate with known baselines. You’ll cross-check live values against historical trends, sensor health, and module consistency, ensuring the observed spike isn’t a transient anomaly. Treat signal integrity as your compass: align voltage, timing, and CAN bus messages, then confirm with alternate diagnostics to avoid confirmation bias. If readings diverge, pause and reframe the hypothesis, collecting sufficient samples before verdicts. Emphasize data reliability by filtering noise, validating thresholds, and documenting context for future audits. In this workflow, you maintain autonomy while preserving precision, balancing critical thinking with disciplined observation to separate genuine faults from misinterpretations.
Checking Sensor Scaling, Units, and Conversion Factors
Before you rely on sensor readings, verify that scaling, units, and conversion factors match the vehicle’s specifications. You’ll confirm that each channel’s range, offset, and gain align with factory data before trusting the display as truth. Systematically compare the tool’s configured scaling to the OEM’s documented values, and note any discrepancy. If units differ (metric vs. imperial, metric prefixes, or voltage vs. current), adjust the tool or the data interpretation accordingly, then re-check. Ascertain that conversion factors between raw sensor outputs and engineered quantities are correct, including temperature, pressure, and flow transforms. Perform calibration checks where available, logging any drift or mismatch. That record becomes part of your diagnostic narrative, preserving sensor accuracy under scrutiny. Maintain discipline: document tolerances, confirm wiring integrity, and revalidate after service interventions. Precision here reduces misinterpretation risk and preserves your freedom to diagnose confidently.
Managing Timing Windows, Sampling Rates, and Data Freshness
Timing window choices determine how you capture relevant events without aliasing or missing bursts. Your sampling rate sets the cadence for data updates and the representativeness of measurements across the test window. We’ll establish data freshness metrics to balance timeliness with stability, ensuring you can trust the tool’s outputs for real-time decisions.
Timing Window Management
To manage timing windows effectively, you must align sampling rates with the data you need and the system’s response requirements. You’ll set clear targets for latency, data freshness, and window width, ensuring the tool’s readouts reflect real conditions. Use timing protocols to define how often you poll, log, and confirm updates, avoiding stale or jittered results. Establish synchronization techniques between the scanner, ECU, and dashboard displays to minimize phase shifts and misalignment. Document chosen windows, justify defaults, and adjust only when evidence shows drift or missed events. Maintain a disciplined cadence: small, regular samples beat sporadic bursts. Verify continuity across subsystems, and guard against compensating artifacts that disguise real faults. This approach preserves data integrity while granting you decisive, freedom-enhancing confidence.
Sampling Rate Impact
Sampling rate is the backbone of timing window management, directly shaping data freshness, latency, and fault visibility. You adjust sampling rate to align data cadence with your diagnostic goals, avoiding gaps that mask intermittent events. A higher sampling rate improves data integrity by capturing rapid shifts, but it also increases overhead and storage strain. Conversely, a lower rate reduces noise and resource use but risks missing critical spikes. You must balance cadence with the tool’s processing window, ensuring the data stream remains representative of real-time behavior. In practice, set a rate that matches expected fault durations, validate with repeatable tests, and monitor for data gaps. Remember: sampling rate directly governs interpretation reliability and overall data integrity.
Data Freshness Metrics
Data freshness metrics quantify how up-to-date the collected data is within your timing window, and they guide decisions about sampling cadence, latency targets, and fault visibility. You’ll align timing windows with the instrument’s data production rate to avoid stale readings and missed events. Track sampling intervals to guarantee you capture relevant transient states without overwhelming the tool or the network. Explicitly relate data freshness to data accuracy, so you understand when a measurement is trustworthy versus when it requires corroboration. Consider sensor reliability across operating conditions; degradation can silently skew freshness. Establish clear thresholds for acceptable delays and for detecting out-of-sequence samples. Regularly validate freshness against real-world events, and document the rationale for chosen cadences to preserve diagnostic clarity and system freedom.
Interpreting PID and Control Loop Values Without Alias
Interpreting PID and control loop values without alias requires a precise, step-by-step approach. You’ll verify sensor and actuator IDs first, ensuring the tool’s data set matches the vehicle’s firmware scope. Next, isolate each PID by value range, preventing cross-talk between similar signals. Apply PID interpretation techniques: plot P, I, and D components separately, correlate with commanded vs actual output, and note steady-state errors. Confirm timing consistency: sample rate, data update frequency, and dwell time must align with the vehicle’s control cycle. When alias risk appears, cross-check with alternate sensors or diagnostic frames to corroborate readings. Maintain a disciplined control loop analysis: compute error signals, observe response latency, and distinguish feedforward from feedback dynamics. Document anomalies concisely, including bracketed timestamps and frame identifiers. Finally, revalidate after minor parameter changes to confirm interpretation remains stable. This method preserves clarity, supports freedom in exploration, and minimizes misinterpretation.
Troubleshooting Communication Quirks and Data Gaps
When you move from parsing PID and control-loop values to troubleshooting, you’ll often encounter communication quirks and data gaps that obscure true performance. You’ll methodically verify every hop in the data chain, focusing on timing, baud decisions, and handshakes to preserve data integrity. Maintain strict discipline: separate sensor lag from protocol latency, and document anomalies with precise timestamps. Prioritize robust interpretation over rumor, distinguishing transient glitches from systemic faults. Cross-check against known behavior for your communication protocols, and isolate where misinterpretation arises. Ascertain the tool’s output isn’t filtered by display limits or memory buffers. If gaps appear, re-run with alternate polling rates and confirm consistency. Benchmark stability under load, then adjust expectations accordingly. Table below distills the approach to communication quirks and data gaps.
| Symptom | Action |
|---|---|
| Latency spike | Verify baud, parity, and flow control |
| Missing samples | Recheck polling interval and buffer limits |
| Inconsistent values | Correlate with concurrent events and logs |
| CRC mismatches | Validate framing and error handling |
| Time drift | Synchronize tool clock and vehicle time |
Cross-Referencing Live Data With Known Benchmarks
Cross-referencing live data with known benchmarks is essential to validate measurements and isolate anomalies. You’ll compare real-time readings against established live data benchmarks from the same vehicle model and operating conditions. This process helps you separate sensor drift, transient spikes, and software errors from genuine faults. Begin by selecting stable baselines—idle, steady rpm, and predefined load scenarios—and record the corresponding values. Next, quantify tolerances and confidence intervals so deviations are interpretable, not alarming. When a reading diverges, ask: is the discrepancy repeatable, timing-sensitive, or environment-driven? Use the tool’s filtering options to align data streams and remove noise before judgment. Maintain a traceable log linking each benchmark to the exact test condition, tool version, and calibration date. This discipline improves diagnostic accuracy, supports evidence-based conclusions, and enables repeatable validation across sessions. You’ll gain clarity, reduce misinterpretation, and reinforce your diagnostic credibility.
Establishing a Repeatable Diagnostic Workflow
Establishing a repeatable diagnostic workflow means outlining a step-by-step process you can execute consistently across vehicles and sessions. You’ll define a baseline protocol, then adapt only when data indicates a genuine need. Begin with objective data collection, then verify with known benchmarks, and finally confirm findings via repeat tests. Maintain version control of procedures and tool configurations to preserve diagnostic consistency. Document each step, result, and decision to enable rapid replication in future sessions. Focus on minimizing variable factors, such as instrument interpretation or environmental noise, and prioritize reproducible outcomes over single-vehicle conclusions. Build in checkpoints to prevent premature conclusions and guarantee workflow efficiency through structured timing, data tagging, and rollback options. This disciplined approach grants you freedom through reliability, not through improvisation.
| Step | Action | Expected Result |
|---|---|---|
| 1 | Collect data | Baseline snapshot |
| 2 | Cross-check | Benchmarked alignment |
| 3 | Confirm | Reproducible outcome |
| 4 | Document | Traceable record |
Frequently Asked Questions
How Do I Verify Full Data Stream Availability Across All Modules?
A single data storm would be easier to quell than guaranteeing full data stream availability across all modules, but you can do it. Verify module communication by checking heartbeat signals and time stamps, confirm data stream integrity with parity checks and sequence counters, and map all modules to a known topology. Validate continuous polling cadence, watch for dropped frames, and revalidate after resets. Maintain a precise, disciplined approach to guarantee universal data visibility.
What Causes Persistent PID Values to Appear Anomalous?
Persistent PID values appear anomalous due to faulty sensors, data interference, and signal noise, often compounded by software glitches and incorrect parameters. You should verify sensor health, cross-check with alternative data streams, and inspect environmental factors that could skew readings. Rule out software issues, recalibrate, and reset parameters as needed. Address intermittent interference sources, log timestamps, and compare against baseline. Only then can you confidently attribute anomalies to hardware or software root causes, not random noise.
How Can I Detect Aliasing in High-Rate Live Data?
Aliasing in high-rate live data shows up as apparent, repeating patterns when your sampling rate isn’t enough. You detect it by varying sampling intervals, comparing spectra, and watching for lost or mirrored frequencies. Use data sampling and signal processing concepts: compute FFTs, check Nyquist limits, and look for nonphysical periodicities as you increase sample rate. Confirm with resampling, anti-alias filters, and cross-checks across channels to reveal true signals amid artifacts.
When Should I Reset or Recalibrate Sensors During Tests?
You should reset or recalibrate when measurements drift beyond your defined tolerance, or when sensor fault indicators appear. Follow sensor reset scenarios only after confirming data anomalies aren’t caused by wiring, grounding, or timing issues. After a reset, apply recalibration guidelines precisely—allow stabilization, lock reference channels, and revalidate against known standards. Schedule resets at clearly defined test milestones, and document results. Maintain accountability, but preserve your sense of freedom with disciplined, repeatable procedures.
What Naming Conventions Ensure Consistentlivedata Interpretation?
Consistency comes from strict naming standards that align with data labeling so you interpret live data accurately. Use descriptive, unambiguous tags, versioned identifiers, and unit-aware names that reflect sensor intent and measurement context. Enforce prefixes for data source, metric type, and range, plus documented conventions for enums and timestamps. This discipline prevents misinterpretation and keeps your toolkit flexible for broader analyses while you pursue freedom in exploration and insight.

