When to Trust the Scanner Vs Understanding Symptoms for Noisy CAN Bus
You shouldn’t trust the scanner alone for noisy CAN bus diagnostics; you must couple its data with careful symptom interpretation and controlled experiments. Start by evaluating frame errors, timing, IDs, and CRCs, then map symptoms to likely fault classes. Isolate noise sources with shielding, grounding, and termination tests, and verify electrical noise isn’t masquerading as protocol faults. Maintain repeatable tests and a hypothesis-driven plan. If you keep exploring, you’ll uncover deeper diagnostic steps and criteria.
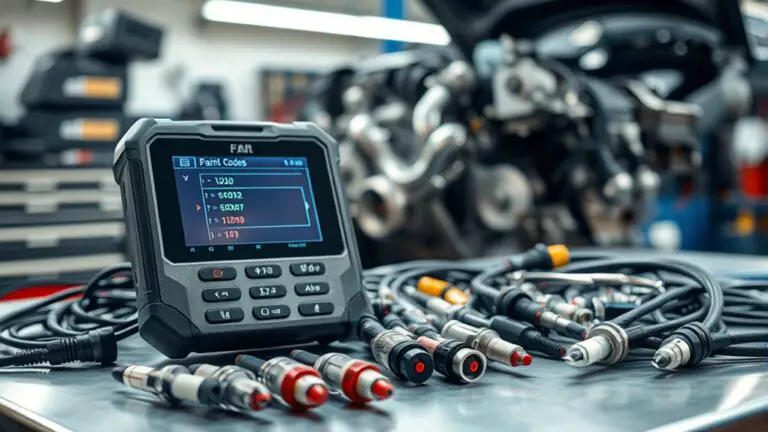
Assessing Scanner Data: What It Tells You About Frame Errors
When you examine scanner data, you’re looking at how the CAN bus communicates in real time and what that implies about frame integrity. You’ll focus on signal timing, frame length, and error counters to gauge reliability. This is not a pledge to trust every bit, but a method to quantify consistency. With scanner reliability in mind, you compare observed frames against expected patterns, noting gaps, re-transmissions, and arbitration anomalies. Frame analysis becomes your baseline: identify dominant IDs, monitor payload stability, and track how often CRC checks fail or are skipped. You’ll separate transient glitches from systemic issues by correlating timestamps with known network activity and device behavior. Precision matters: document counts, margins, and border conditions where frames appear malformed yet valid. Maintain discipline in interpretation, resisting overgeneralization. In short, scanner data offers a disciplined lens for diagnosing frame integrity while preserving your freedom to investigate deeper symptoms when necessary.
Interpreting Symptoms: Beyond the Raw Trace
Are the symptoms you observe on the CAN bus just noise, or do they point to a deeper issue beyond the raw trace? You’ll interpret patterns by focusing on symptom analysis rather than buzzing data alone. Look for repeatability, timing anomalies, and context—not just single-frame glitches. Map symptoms to potential fault classes, then test with targeted diagnostic strategies: verify bit timing, frame IDs, and payload integrity; isolate offending nodes; and reproduce conditions under controlled loads. Treat the trace as a pointer, not the final verdict.
| Symptom | Likely Cause | Verification Step |
|---|---|---|
| Intermittent errors | Arbitration or bus load | Capture with extended window; compare with known-good baseline |
| Consistent bit flip | Transceiver issue | Swap node; monitor supply and ground integrity |
| Sporadic CRC failures | Data corruption; timing drift | Run stress tests; analyze clock coherence |
| Framing delays | Queueing or bus congestion | Measure message cadence; correlate with activity |
In this approach, you frame diagnostic strategies around symptom analysis to guide precise interventions without overreacting to noise.
Correlating Events: When Symptoms Align With Specific Signals
When you track symptom-signal alignment, you’ll map specific fluctuations in the CAN trace to corresponding events, establishing a one-to-one or probabilistic relationship. Use clear correlation rules to decide whether a symptom pattern matches a signal, a mismatch, or requires additional evidence. This sets the foundation for repeatable diagnostics by tying observable symptoms to defined CAN signals.
Symptom-Signal Alignment
Symptom-signal alignment is about linking observed symptoms to specific CAN bus signals to pinpoint root causes efficiently. You’ll map symptom categories to corresponding signal patterns, building a structured hypothesis rather than guesswork. Begin with symptom categorization: classify what you observe (timing, duration, occurrence) and note repeating contexts. Next, pursue signal validation: verify that the implicated CAN signals consistently reproduce the symptom under controlled conditions, ruling out noise and transient glitches. This approach forces discipline in data handling, ensuring you don’t chase incidental anomalies. Keep measurements synchronized, document thresholds, and compare against baseline behavior. The result is a precise, evidence-backed narrative that guides debugging, not speculation, empowering you to act with confidence and freedom within engineering constraints.
Event Correlation Rules
Event correlation rules translate observed symptoms into actionable signal relationships by formalizing the conditions under which specific CAN signals align with anomalies. You’ll define precise causality links that connect symptom patterns to signal behavior, minimizing guesswork. Start with robust event classification: categorize each symptom by timing, duration, and frequency, then map it to candidate signal states. Use structured criteria to separate coincidental coincidences from meaningful alignments, ensuring reproducibility. Next, perform signal analysis to assess correlation strength, latency, and sequence. Document thresholds, confidence levels, and exception handling, so rules remain transparent and auditable. Regularly review rule sets against new data, adjusting for bus dynamics and hardware changes. This disciplined approach supports informed decisions about trust in a scanner versus symptom-driven insight. Maintain clarity, consistency, and traceability.
Controlled Experiments: Shielding, Grounding, and Termination Tests
Shielding, grounding, and termination tests form the core controls for isolating environmental and system noise while you assess CAN bus integrity. You’ll compare shield effectiveness, verify proper grounding schemes, and confirm termination robustness under realistic load and fault scenarios. Keep measurements repeatable, document connector practices, and isolate each variable to attribute observed changes to the correct mechanism.
Shielding Effects
Controlled experiments on shielding, grounding, and termination assess how electromagnetic and electrical noise couples into CAN bus hardware and whether enclosure or cabling choices mitigate it. You’ll compare shielded vs. unshielded jackets, and evaluate enclosure permeability, feedthroughs, and grounding integrity. Shielding materials and grounding techniques must be documented, repeatable, and measurable; results show how interference attenuates before reaching the transceiver. You observe coupling paths, measure differential and common modes, and quantify with repeatable metrics. The table below conveys patterns where tighter shielding and proper grounding consistently reduce noise ingress, while gaps or poor terminations elevate it.
| Scenario | Noise Level Change | Confidence |
|---|---|---|
| Basic shield | −6 dB | Moderate |
| Advanced foil | −12 dB | High |
| Grounded chassis | −9 dB | High |
| No shield, floating | +3 dB | Low |
Termination Tests
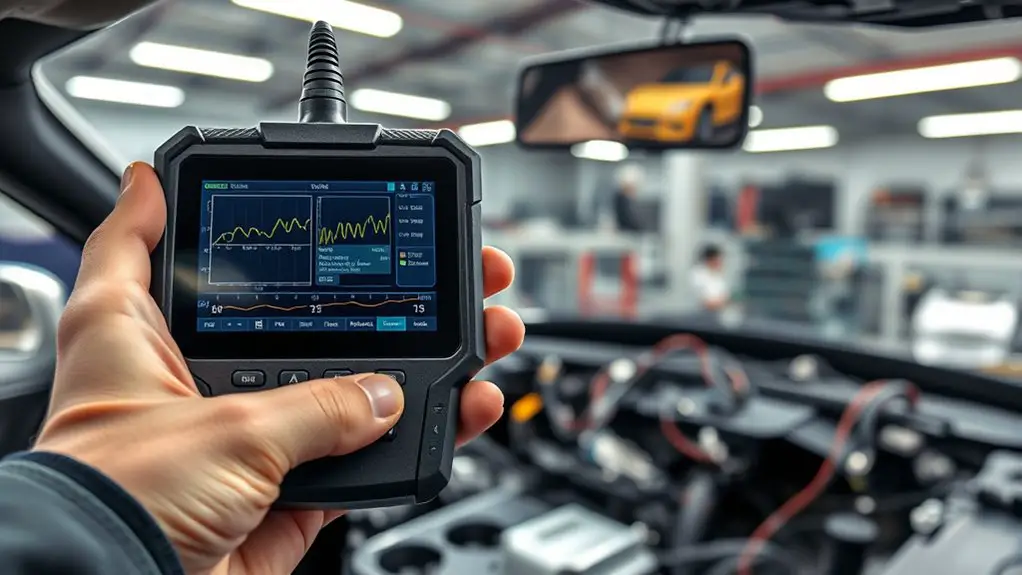
Termination tests build on shielding and grounding results to quantify how properly placed terminations affect CAN bus noise ingress. You conduct controlled experiments by inserting known termination impedances at network ends and measuring reflections, common-mode noise, and differential voltage stability. Begin with the nominal bus impedance, verify cable integrity visually and with time-domain reflectometry, then compare with tertiary terminations to observe delta in noise floor. Record termination impedance values, cable gauge, connector quality, and routing changes to isolate effects. Use a signal generator and oscilloscope to capture edge ringing, overshoot, and propagation delay, documenting how impedance mismatches amplify or dampen transients. The goal is repeatable data that informs practical adjustments, ensuring robust performance without over-constraining the network.
Identifying Electrical vs. Protocol Issues
Electrical versus protocol issues manifest differently on a noisy CAN bus, and distinguishing them requires a methodical approach: verify physical layer conditions first, then test protocol behavior. You’ll start with measurements of cable integrity, termination, and connector conditions, looking for irregular reflections and excessive impedance. Electrical noise sources are your first clue: ground shifts, common-mode disturbances, and power rail ripple should be minimized before you touch higher-layer analysis. If the bus remains noisy after clean wiring, you’re probing protocol behavior rather than the hardware. When you observe frame formatting inconsistencies, arbitration errors, or mismatches in timing expectations, consider protocol discrepancies. Use deterministic logging, timestamp alignment, and observable bit-stuffing patterns to separate artifacts from genuine protocol faults. The goal is a clean signal and a predictable protocol response. By isolating electrical noise from protocol discrepancies, you gain confidence that your diagnosis targets the correct layer. Freedom here means disciplined, data-driven validation.
Prioritizing Hypotheses: A Systematic Diagnostic Framework
To diagnose a noisy CAN bus efficiently, start with a hypothesis-driven plan that ranks potential causes by likelihood and impact, then test each in a disciplined sequence. You apply a systematic approach: define hypotheses, assess evidence, and discard incongruities with objective criteria. Prioritization focuses on high-probability, high-impact sources first, using measurable metrics and traceable decisions. This framework reduces noise from anecdote and emphasizes repeatable tests, ensuring you maintain control over the diagnostic path. Hypothesis testing becomes a loop: hypothesize, collect data, evaluate, adjust, and proceed. Document decisions to support reproducibility and future audits. A disciplined sequence minimizes unnecessary probing and accelerates detection of root causes. Maintain traceability between observations and conclusions, and keep the process adaptable to new data without collapsing into chaos.
| Step | Focus |
|---|---|
| 1 | Hypothesis generation |
| 2 | Evidence collection |
| 3 | Decision & next step |
Case Studies: Real-World Scenarios and Decision Points
Case studies illuminate how the diagnostic framework plays out in practice, showing how real-world data, constraints, and risk tolerances shape decisions. You’ll see how case study analysis distills signals from noise, translating symptoms into testable hypotheses while respecting operational limits. Diagnostic challenges arise when CAN noise mimics legitimate frames, or when intermittent faults evade quick detection, demanding disciplined data gathering and traceability. You’ll evaluate trade-offs between scanner certainty and symptom interpretation, balancing time-to-resolution against potential system impact. The emphasis stays technical, yet you’ll feel the freedom to adapt methods to your environment, not rigidly follow a checklist.
Case studies show how real-world data and limits shape diagnostic decisions, balancing speed, certainty, and risk.
1) In-flight vs on-bench comparisons reveal how context alters evidence weight.
2) Correlation vs causation tests expose where assumptions risk misdirection.
3) Failure timelines and confidence intervals guide when to escalate or defer actions.
Building a Verification Plan: From Baseline to Problem Isolation
A solid verification plan starts with a well-defined baseline and a clear path to isolate problems, guiding you from normal CAN behavior to the specific fault. You’ll establish a baseline analysis that captures timing, message IDs, error counters, and bus load under steady conditions. Next, define measurable evidence points and success criteria, so assessments stay objective rather than speculative. Build incremental test steps that move from passive observation to active probing, recording how each stimulus shifts the system’s state. Use controlled variations—node count, arbitration load, and fault injection—while maintaining repeatability. Document deviations precisely, linking them to suspected fault classes and available diagnostics. Prioritize problem resolution by mapping symptoms to targeted checks, such as bit-stuff errors, CRC mismatches, or dominant NERRs. Maintain traceability from baseline to fault hypothesis, ensuring that each action narrows the search. Finish with a concise remediation plan, criteria for re-baselining, and verification of completed fixes.
Frequently Asked Questions
Can a Clean Trace Still Hide Protocol-Layer Issues?
Yes, a clean trace can still hide protocol-layer issues. You must inspect signal integrity beyond eye-closure, checking timing margins, worst-case bit stuffing, and arbitration behavior. Rely on protocol analysis to reveal misinterpreted frames, state machine glitches, or hidden retransmissions. Don’t assume pristine edges mean correctness; verify bit timing, bus idle, and error counters. You’ll diagnose holistically, using disciplined checks rather than assuming cleanliness equals health.
How Do Noise Patterns Differ From Legitimate Frames?
Noise patterns differ from legitimate frames by timing, amplitude, and bit-stuffing anomalies rather than payload structure. In noise analysis, you’ll see irregular interframe gaps, sporadic voltage spikes, or jittered bit shifts that don’t align with protocol timing. Legitimate frames maintain consistent bit rates and checksum validity, preserving frame integrity. You’ll compare envelopes, CRCs, and spacing, isolating bursts from defined signals. Trust signal consistency, not a single anomaly, to avoid misinterpreting noise as valid data.
When Should I Replace the CAN Transceiver vs. Adjust Wiring?
When to replace a CAN transceiver vs adjust wiring? Replace the transceiver if you observe persistent transceiver failures, saturating error frames, or voltage-level faults after verified wiring integrity checks. If diagnostics show intermittent, high-impedance or ground-loop issues, rework wiring first. Maintain solid terminations and shielding, then retest. If wiring checks pass yet errors persist, suspect the transceiver. Address transceiver failures promptly, but preserve wiring integrity as the foundation for reliable bus operation.
Do Library/Tool Differences Affect Fault Interpretation?
Yes, library differences can affect fault interpretation. You’ll want to evaluate library reliability and tool accuracy before drawing conclusions. If a library provides inconsistent parsing or timing, your fault flags may shift with builds or versions. You should validate results against a known-good setup, cross-check using multiple libraries, and document versioning. In practice, treat library reliability as part of your measurement system, and maintain traceability to guarantee interpretations stay meaningful across tool updates.
Can Symptoms Precede or Predict a Fault?
Symptoms can precede a fault, enabling fault prediction through careful symptom analysis. You should monitor patterns, intensities, and timing of CAN bus anomalies, correlating them with historical faults. By systematically documenting symptoms, you can anticipate issues before failures occur. Trust the scanner for real-time indicators, but rely on symptom analysis to forecast risks. This methodical approach preserves freedom to act proactively while maintaining technical precision in diagnosing potential faults.